Increasing the safety of high head power plants by means of numerical investigation of valves and systems
Bild: © Jaberg
By applying computational fluid dynamics (CFD) methods, the hydraulic characteristics of various types of valves and shut-off devices – such as pressure loss and acting forces – can be precisely determined. This information is of essential interest not only for green filed projects, but also for the refurbishment of existing power plants. With the help of two case studies the presented paper shows, how safety-related problems in hydropower plants can be addressed by expert and careful application of numerical methods.
© Jaberg
Case study #1: Pumped storage power plant Limberg III
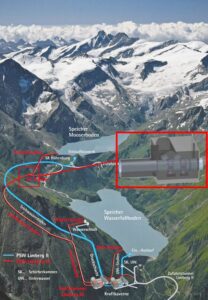
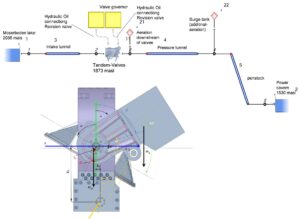
At the hydro power plant site “Kaprun”, the power plant capacity will be upgraded with the construction of the Limberg III pumped storage power plant. In the course of this upgrade, a new headrace system (headrace tunnel, surge tank and penstock) will be constructed between the existing reservoir Mooserboden and the Wasserfallboden reservoir, including an all-new cavern powerhouse. Furthermore, a new valve chamber (SK Drossen), hosting a DN4900 tandem butterfly valve arrangement, is to be installed serving as a shut-off and safety device (see Figure 1).
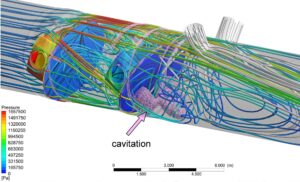
The aim of the presented investigation was to determine the behaviour of the butterfly valves in a catastrophic case of a penstock burst, which hopefully will never occur, but cannot be ruled out. The only possible location in the headwater system where such a disaster could occur is the inlet of the spherical valves at the pressure side of the pumped turbines. If these would be destroyed in terms of a catastrophic event, the shut-off valves provide the only remaining possibility to prevent the entire volume of the dam from flooding the valley below. In order to guarantee a high safety standard, two similar shut-off valves are typically placed in the valve chamber, which have to be suitable for emergency closing independently from each other. As it may happen that one of the shut-off valves fails in course of the emergency closing, the second valve has to be operated independently and should be able to close. Since the flow-rate through the valves in case of a penstock burst will be several times higher than the nominal flow rate, the resulting loads on the mechanical construction of the valves will dramatically increase compared to normal operation. In addition to the investigation of the butterfly valves, the spherical valves upstream of the pump turbines of this power plant were analysed as well (see Figure 4).
© Jaberg
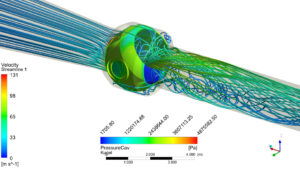
By means of a 3D CFD–analysis (see example presented with Figure 2) the hydrodynamic behaviour of a valve can be analysed. This allows for fast and precise calculation of results concerning the loads to be expected. Another advantage of a CFD-based approach is the ability to react quickly to any geometric adaptations that may become necessary. Additionally, a potential risk of cavitation can be identified.
© Jaberg
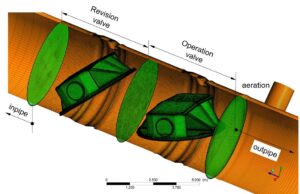
In high head hydro-power plants, a ventilation downstream of the emergency shut-off valve is often installed to protect the headrace tunnel against inadmissible pressure below ambient pressure. For this purpose, enhanced 3D-CFD-simulations have to be carried out as multi-phase simulations in order to determine the required air volume (Figure 3) on the one hand and its effect on the hydraulic performance and the loads on the other hand. By applying this method, the effect of cavitation on the hydraulic characteristics can be analysed as well.
© Jaberg
While the 3D-CFD analysis provides the loads acting on the valve in such a case, a one-dimensional transient CFD calculation (water-hammer analysis) is used to determine the dynamic shut-off behaviour of the emergency valve in the hydraulic system of the hydro power plant in case of a pipe burst. In case of the presented transient analysis for Limberg III, a tailor-made numerical representation was developed for the tandem-valves. Sophisticated mathematical models were required in order to calculate the torque equilibrium and to solve the equation of motion around the valve axis (see Figure 5).
© Jaberg
Apart from the hydraulic forces resulting from the 3D-CFD simulations all other occurring forces acting on the valve cinematics (like servo pressure, friction and gravity) are considered. By applying this method, the dynamic behaviour of the valves in case of a pipe burst event can be calculated in detail. However, the closing behaviour of the valves, which is of essential interest, can be adjusted in terms of transient 1D simulations by changing the resistance of the servo cylinder throttling. Hence, the pressure transients in the headrace system of the power plant during such a disaster as well as the loads acting on the valves can be precisely predicted.
The calculation finally provides the shut-off behaviour, the closing time of the valve resulting from the actual flow conditions and all safety-relevant data such as the maximum loads on the components or the amount of water leaking into the environment in course of a pipe burst event. Another type of valve is the so-called safety valve. In contrast to the valves and flaps shown previously, these open in case of emergency to provide a bypass for the turbine and/or pump. This arrangement enables to reduce maximum pressure peaks in the piping system and subsequently positively influences the transient hydraulic behavior of the piping system (e.g. faster shutdown of the hydraulic machine).
,
wall surfaces with pabs < 0,2 mbar (right)")

 and 2-phase flow (water and air, right)")

Case study #2: Pressure regulator for pump station Hattelberg
As a safety device, a so-called pressure regulator is installed on the suction side of a single-stage high-head-pump with a rotation speed of n=3000 rpm. In case of an emergency, the pressure regulator should reduce the energy and release the water into the absorbation chamber located below the power plant. The release of the water helps to handle water hammer problems in case of pump failure. At the nominal operation point, the pressure regulator should achieve a flow rate of Q = 4.5 m³/s at the nominal pressure head of H = 574.12 mWs (nominal head of the pump ~1450 mWs ).
© Jaberg
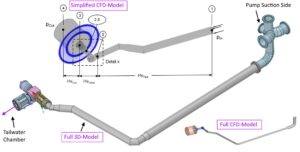
In course of the simulation, the absorbation chamber was modelled as so-called “outblock”(Figure 6 – CFD-Models). The numerical calculations were carried out with a simplified model as well as with a full model containing the entire piping bewteen the pump suction side and the pressure regulator. Beside the two CFD-models, the numerical calculations were performed with 1-phase calculations (water only) as well as with 2-phase calculations to evaluate the influnce of the water and air filled absorbation chamber.
Figure 7 shows the velocity field in the centre plane of the pressure regulator of the 1-phase (left) and of the 2-phase flow calculation with a maximum valve stroke (right). In case of the 1-phase calculation it is assumed that the “outblock” is completely filled with water and in the 2-phase calculation with a mixture of water and air. The exit velocity from the pressure regulator at a distance of about 1.75 m is almost twice as high for the air-filled absorbation chamber (65-70 m/s) as for the water-filled absorbation chamber (35-40 m/s).
© Jaberg
Due to the extremely large pressure difference between the inlet and outlet, high velocity gradients are obtained. This results in an intense transient behaviour of the flow (flow separation, formation of strong vortex structures, …) in the area of the pressure regulator (especially after the 1st stage). Figure 8 shows the strongly pronounced vortex zones at different valve openings. At small openings, these vortex structures occur at the piston resulting in a strong influence on the force situation of the piston. With larger openings, the vortex structures shift to the area between the 1st and 2nd stage of the pressure regulator.
As a result of very high flow velocities, especially at the second stage of the pressure regulator, cavitation can occur. Due to excessive cavitation, the flow space may be blocked and the discharge through the pressure regulator may decrease. Furthermore, complete blockage leads to chocked flow in valves. However, the calculations carried out do not take this possible chocked-flow effect into account. The cavitation zones do not appear to be large enough to achieve this effect. Nevertheless, Figure 9 illustrates the zones where cavitation could occur.
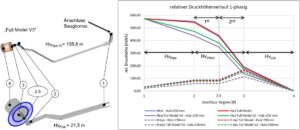
Using experience in the design and layout of the piping system, as well as the installation of the pressure regulator, the optimal solution was found with the assistance of complex numerical methods. As shown in Figure 10, the pressure regulator and its associated components were dimensioned in such a way that the reduction of the total pressure head (head losses) was evenly distributed across the pipe section and the first and second stages of the pressure regulator (the final version is depicted in purple). The increased pressure loss in the pipe section helped to reduce the significant forces on the pressure regulator piston and additionally lowered its highly dynamic behavior.
Author: Christian Bodner, Stefan Höller and Jürgen Schiffer