New suspended solids concentration (SSC) measurement with integrated size class detection
The massive glacier melt this year has clearly shown us the major changes high alpine glaciated areas are subject to. The retreat of the glaciers is exposing ever larger alpine areas, from which sediments enter the streams and thus the water intakes of the power plants during precipitation. These suspended sediments in the drive water of the hydropower plants cause massive hydro-abrasive wear on exposed turbine components. A decrease in the turbine efficiency and rising operating costs due to more frequent and more extensive maintenance work are the consequences (Abgotspon et al., 2022). In order to be able to minimise this damage, suspended sediments monitoring is required, which not only measures the concentration of suspended sediments, but also provides information on the size distribution of the suspended particles [Abgottspon et al. 2016].
Kraftwerke Mattmark AG operates a hydroelectric power plant in Stalden VS/Switzerland with two machine lines, each consisting of two Pelton turbines, with a total output of 185,000kW. The catchment area of the power plant is mostly located in areas influenced by glaciers. For this reason, Kraftwerke Mattmark AG have agreed to install a new measurement system to record the concentration of suspended solids and their size distribution as a pilot project in spring 2022. The aim is to be able to discharge the inflowing water directly at the water intakes in the case of very high concentrations of suspended solids and, at the same time, to be able to immediately turbinate the water again as soon as the concentrations of suspended solids decrease.
Measurement methodology and range
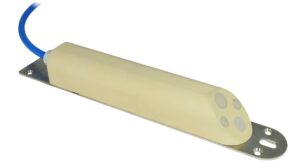
The measuring principle behind the multi-frequency echo method is based on the backscattering and attenuation of ultrasonic waves on particles carried in flowing media. In the pulse-echo method, an acoustic impulse is sent into the medium and the intensity of the backscattered signal is measured. This process is repeated with different frequencies emitted by a total of 4 acoustic transducers (Fig. 2) to obtain scattering signals from particles of different sizes. The aim here is to obtain the average and standard deviation for the backscatter coefficient and the effective attenuation of the ultrasonic wave by the medium. Particle concentration and size class distribution (PSD) are then determined from these parameters using complex mathematical equations.
The system can measure up to a maximum suspended solids concentration of 6000mg/l without calibration. Concentrations greater than 6000mg/l are detected, but can no longer be determined accurately due to the multiple scattering effect. Therefore, only a qualitative measurement can be carried out for SSCs > 6000mg/l. However, in order to reduce the measurement uncertainty at higher concentrations, a calibration curve from laboratory measurements with representative sediment samples can be stored in the system. The particle size is specified in five size classes: <63µm, 63 – 100µm, 100 – 200µm, 200 – 400µm and 400 – 1000µm.


Installation
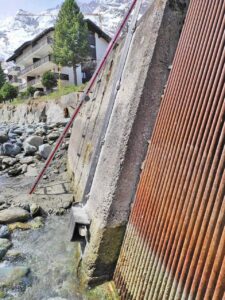
The sensor can be installed directly in the channel or pipe and does not require any complex installation e.g. using a bypass and/or pump control. In addition, the operation of the sensor is largely maintenance-free. In Saas-Fee, the sensor was installed directly in front of the inlet screen of the water intake in the channel of the mountain stream Saaser Vispa during low water in February 2022 (Fig. 1). Consequently, an alarm can be triggered if a threshold value of 4000 to 6000mg/l is exceeded and the water can be discharged in a controlled manner. At the same time, the drop-in sediment concentration can be detected in real time so that when the concentration is low enough, the volumetric flow can be rerouted back to energy production without causing damage to the turbines. The sensor was installed in a way so that the ultrasonic signals are emitted into the water in downstream direction thereby avoiding any possible damage to the ultrasound transducers by flotsam or debris impact. In order to protect the sensor further sensor housing and cables were shielded with solid steel plates by employees of the Kraftwerke Mattmark AG. Turbulences that occur behind the sensor protection in the sensor’s field of view do not influence the measurement. In addition to the ultrasonic transducers pressure probes were also integrated into the sensor housing for level measurements. Level data is not required for SSC measurements, but it supports the subsequent data evaluation. The measuring transducer was installed 60m away in the control room. From here, the particle concentration, water level and water temperature are transmitted to the control system of Kraftwerke Mattmark AG via analogue signals. The system was commissioned in July 2022.
")


Measurement results and discussion
The following analysis refers to data recorded between 29 July and 1 October 2022. In addition to the data from the particle concentration measurement system, which also records the water level and water temperature in addition to SSC and PSD, flow data from the Stalden hydropower plant were also included for further analysis. Fourteen events featuring a SSC >4000 mg/l occurred during this period. Two of these events had a duration of more than one hour (average: 29 min, median: 17 min). An initial evaluation of the data reveals periodic fluctuations of all measured values during the course of the day. Due to very high temperatures and very little precipitation, the summer of 2022 was characterised by massive glacier melt. Thus, the increases and decreases in flow over the course of the day can be clearly seen, which, as expected, are accompanied by an increase and decrease in suspended sediment concentration (Fig. 3 and 5). The transport of coarser particles (fine sand and medium sand) increases with higher flow velocities (cf. Fig. 4 and 6). From 8 September, water temperature and flow decrease. The glacier melt decreases. This means that hardly any fine and medium sand is transported while silt particles dominate the material composition. (cf. Fig. 6).
On 25 August, sediment concentrations significantly above 6000mg/l were measured over a period of approx. 41 minutes (Fig. 8). Thus, these values exceeded the maximum measuring range of the sensor and hence were subject to a significantly higher measurement uncertainty. Nevertheless, it can be assumed that this was an event with the highest detected sediment concentration (>6000mg/l) within this measurement campaign. A closer look at the particle size distribution for this event (Fig. 9) shows the chronological sequence of the individual size classes, starting with silt, followed by fine sand up to 100µm, low concentrations of fine and medium sand up to 400µm and a relatively large proportion of sand up to 1000µm. This succession of the individual size classes and also the underrepresentation of the size classes up to 200µm and 400µm can be found in all events. Deviating from this, a fraction of 20% was detected on 27 August for the size class up to 400µm and 6% for up to 200µm. This sequence of size fractions within an event contrasts with the observations of a long-term study of hydro-abrasive wear on Pelton turbines at the Fieschertal power plant (approx. 40km straight distance from Saas-Fee). In this study, the d50 parameter of the size-sum distribution curve was determined. The results from this study showed that the d50 value was higher at the beginning of the events (rising branch of the concentration hydrograph) than at the end of the events (falling branch of the concentration hydrograph) (cf. Fig. 7). The reason for this is that for this study the measurement systems were installed downstream of the storage tunnel. As a result, the SSC is influenced by settling and resuspension processes at different water levels during operation of the storage tunnel (Felix, 2017). In the hydrographs of concentration events, additionally (e.g. Fig. 3) a periodic event with a strong, pulsating increase in concentration, combined with a drastic drop in flow, can be seen. This is a flushing process of the screen in the inlet of the water intake. By opening the gate valve behind the water intake, a large amount of water and flotsam, which has collected in front of the screen, is discharged abruptly. This results mainly in the resuspension of particles > 200µm, which had previously settled in front of the water intake (cf. Fig. 10).
Conclusion
The measurement data of this campaign show that during certain events, which are caused by snow and glacier melt, heavy precipitation or also by targeted flushing of reservoirs, large quantities of very small as well as very large particles are transported and led to the turbines. Separation of silt and fine sand (< 200µm) by using a desander is in most cases not possible at economically justifiable expense. However, even small particles cause hydro-abrasive wear on the turbines at high flow velocities and strong flow deflections (Abgottspon et al., 2016). The extent to which the large amounts of sand (> 400µm), as occurred in the event on August 25 (Fig. 9) are separated by the desander can only be determined by measuring the SSC downstream of the desander.
Outlook
In order to better understand the behaviour of the sand trap at high suspended sediment concentrations, but also to be able to schedule maintenance intervals on the turbines more efficiently, in winter 2023 a second SSC measurement system was installed at the same water intake at the end of the sand trap. In this way, on the one hand, the actual SSC and size distribution of the turbined water is recorded, which in the end leads to hydro-abrasive wear on the turbines. On the other hand, this provides Kraftwerke Mattmark AG with information about the sedimentation behaviour in the sand trap at different inflow rates.
Authors:
Sebastian Scheffler, Nivus GmbH, Im Täle 2, 75031 Eppingen, Germany
Dr. Asmorom Kibrom, Nivus GmbH, Im Täle 2, 75031 Eppingen, Germany
Sources:
Abgottspon, A., Felix, D., Boes, R, Staubli, T. (2016): Schwebstoffe, hydo-abrasiver Verschleiß und Wirkungsgradänderungen an Peltonturbinen – Ein Forschungsprojekt am KW Fieschertal. Wasser Energie Luft, 108. Jahrgang, Heft 1: 9–24.
Abgottspon, A., Felix, D., Staubli, T., Boes, R. (2022): Betriebs- und Unterhaltungsoptimierung von beschichteten Peltonturbinen mit hydro-abrasivem Verschleiß – Erkenntnisse aus einem Forschungsprojekt am KW Fieschertal. Wasser Energie Luft, 114. Jahrgang, Heft 2: 105-117.
Felix, D. (2017): Experimental investigation on suspended sediment, hydro-abrasive erosion and efficiency reductions of coated Pelton turbines. VAW-Mitteilungen 238 (Boes R., ed.) und Dissertation 24145, ETH Zürich.